IDA Dynamic Debugging of Native Layer Programs
Here we will introduce how to debug the following types of programs:
- Basic native layer programs, i.e., simple C/C++ programs.
- Native SO programs
Required Tools
- A rooted phone
- IDA
Basic Principles
When using IDA to dynamically debug native layer programs, the main tool used is the android_server program. This program uses ptrace technology to inject into the program being debugged.
Each process has a status file, which contains a field called TracerPid that indicates which process has ptraced this process. If it has not been ptraced by another process, it returns 0; otherwise, it returns the pid of the corresponding process.
Basic Environment Setup
Regardless of what native layer program you are debugging, the basic environment setup is similar — you need to ensure that IDA and the phone can communicate normally.
- Upload the android_server file (located in IDA's dbgsrv folder), and modify its permissions to make it executable
adb push android_server /data/local/tmp/
adb shell chmod 755 /data/local/tmp/android_server
- Start android_server, which will listen on port 23946 (run with root privileges)
adb shell # Enter adb
su # Switch to root
./data/local/tmp/android_server # Start android_server
adb forward tcp:23946 tcp:23946
The connection actually establishes communication between the adb server and adbd on the phone. So the communication looks roughly like this:
IDA↔adb server<--->adbd<---->android_server
PC | Phone
Step 1 only needs to be executed once and does not need to be run again afterwards. Steps 2-3 need to be executed every time, so they can be written into a script and the script's path can be added to the system's PATH environment variable, allowing us to execute a single command to run everything.
Basic Native Program Debugging - Method 1
Basic native programs refer to ordinary C/C++ programs compiled to ARM assembly.
Adding the Program
Here we use the debugnativeapp from http://www.52pojie.cn/thread-554068-1-1.html as an example.
First, we need to push the native program to the Android device and modify its permissions to make it executable, as follows:
adb push debugnativeapp /data/local/tmp/
adb shell chmod 755 /data/local/tmp/debugnativeapp
Starting the Debug Session
Choose the appropriate version of IDA based on the bitness of the native program, then select Debugger-Run-RemoteArmLinux/Android debugger. The interface is as follows:
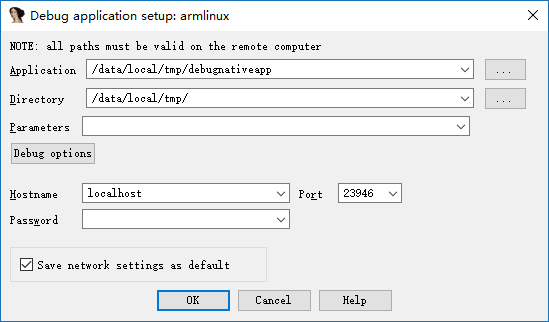
The important parameters are as follows:
- Application
- The absolute path of the program being debugged on the phone.
- Directory
- The directory of the program being debugged on the phone.
- Hostname
- The host we communicate with. Here we communicate directly with the local PC.
The Debug options are set as follows:

The main selection is three Events, which cause our program to automatically stop at the entry point, when a thread starts, and when a library is loaded. Of course, you can also select all of them.
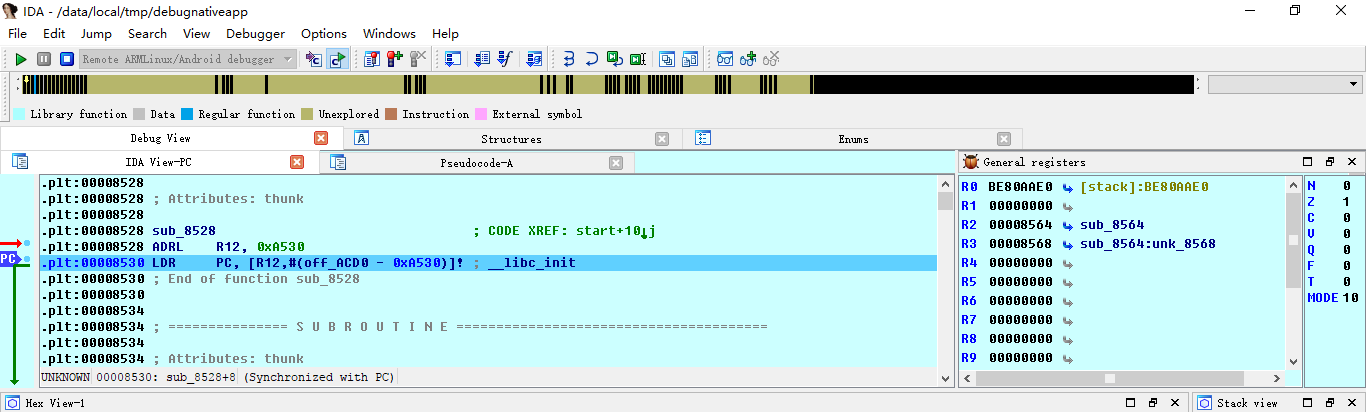
After starting the program, it looks like this:
Notes:
If you see "can not load plugin", it may be because the phone is not rooted.
If you encounter the following issue, just click cancel. The specific cause is unclear.
If you encounter "error: only position independent executables (PIE) are supported", it is usually because the Android phone version is greater than 5. You can try:
Using the PIE version of android_server
- Using 010Editor to change the e_type field in the ELF header of the executable file to ET_DYN(3).
SO Native Program Debugging
For SO native programs, you might wonder what is different from regular native programs. The difference is that SO files cannot run on their own. Typically, other programs call certain functions in the SO file. So here we cannot directly use the "run" method described above. Generally, in Android, SO files depend on APK files.
Here we use the debugjniso.apk from http://www.52pojie.cn/thread-554068-1-1.html as an example.
First, you must set up the basic debugging environment.
Installing the Program
First, we need to install the APK on the phone.
adb install debugjniso.apk
Starting the App in Debug Mode
Next, we need to start the program in debug mode, so that IDA can capture the corresponding process and attach to it.
shell adb shell am start -D -n packagename/.MainActivity
Attaching to the Process
Start IDA Pro, click Debugger-Attach-RemoteArmLinux/Android debugger, fill in localhost for Hostname, and the port defaults to 23946. This is actually the listening port on our local computer. As shown below:
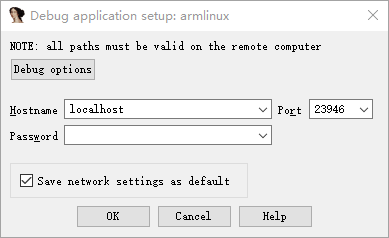
Click ok to start debugging.
Note:
If only one program /bin/sh appears that can be attached, it means android_server was not run with root privileges.
Use ctrl+f to quickly locate and select the corresponding process, as shown below:
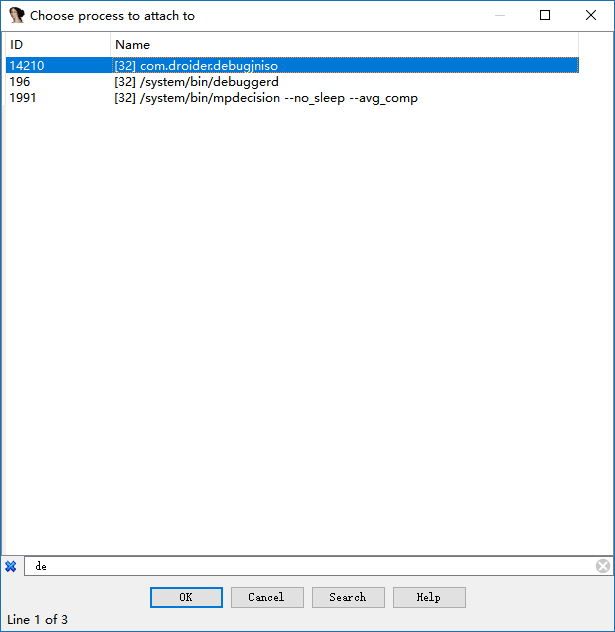
Then click ok to confirm.
At this point, we can see that we have successfully attached.
Now click Debugger-Debugger options, and set the relevant options as follows:
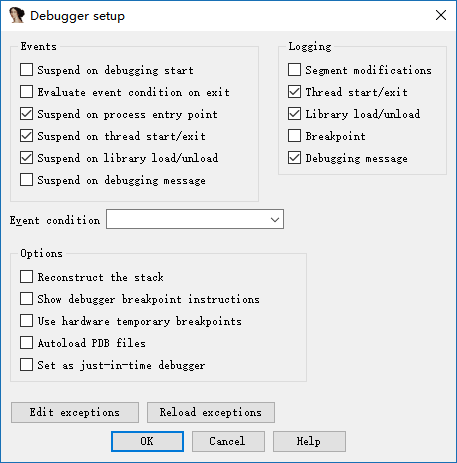
The meaning is similar to native programs.
The reason we set the breakpoints at this point rather than when initially attaching is that if they were set at the beginning of the attach, they would not actually be present at this stage. You can try it yourself.
Resuming App Execution
At this point, the app's interface shows "wait for debugger", and we have already attached to it. Now we need to let the program continue running.
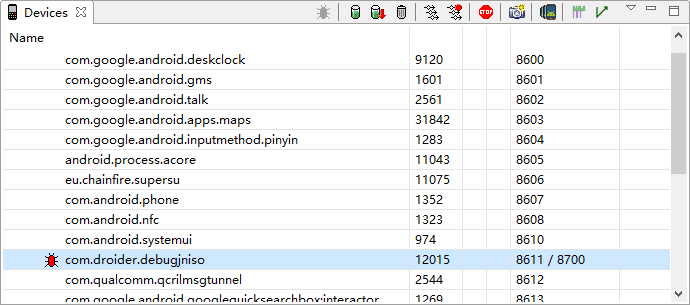
First, we open ddms and select the process we want to debug.
This is essentially equivalent to directly executing:
# Display all debuggable user processes on the phone
adb jdwp
# Establish a connection between port xxx on the PC and the corresponding port on the phone for communication
adb forward tcp:xxx jdwp:<pid>
The reason we don't use commands is that we would need to manually determine the process ID of our APK, which can be cumbersome.
Here is a basic communication process diagram:
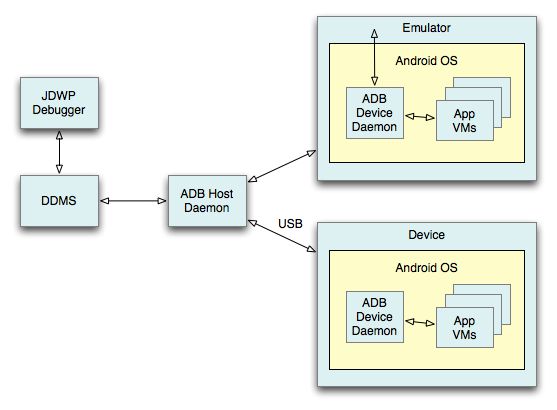
At this point, our computer has established communication with the app's virtual machine on the phone.
Additionally, we need to use jdb at the Java layer to attach our APK application to our computer. We use the following command:
jdb -connect com.sun.jdi.SocketAttach:hostname=localhost,port=xxx
Where xxx is the port 8700 we saw in ddms — this is generally the default. After execution:
C:\Users\iromise
λ jdb.bat

jdb -connect com.sun.jdi.SocketAttach:hostname=127.0.0.1,port=8700
Set uncaught java.lang.Throwable
Set deferred uncaught java.lang.Throwable
Initializing jdb...
>
Let's look at our phone again:
At this point, the app has resumed running and is no longer showing "wait for debugger".
Determining the Native Function Address
Here we open another instance of IDA, import the APK's SO library, and then look for our function in the exports, as shown below:

We can see that its offset is 0xc38.
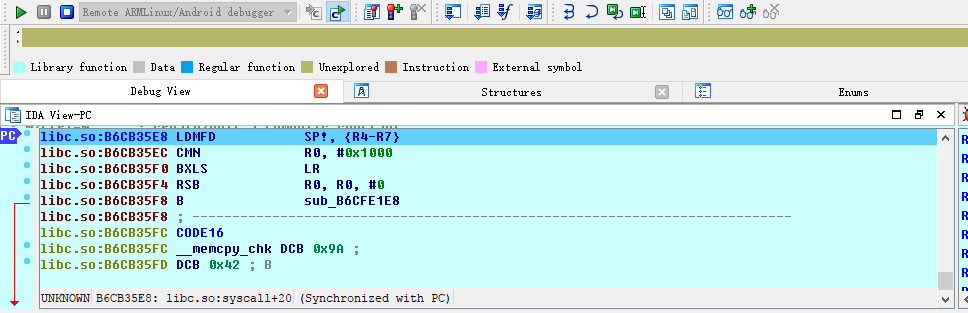
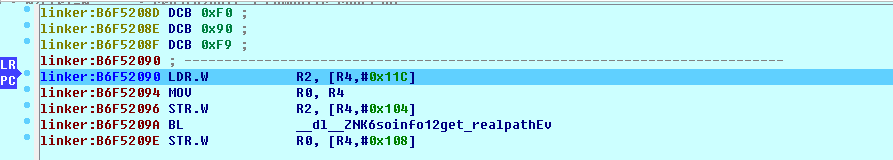
We then press F9 in the debugging IDA until pressing it no longer has any effect. We will see that the program has stopped at the linker:
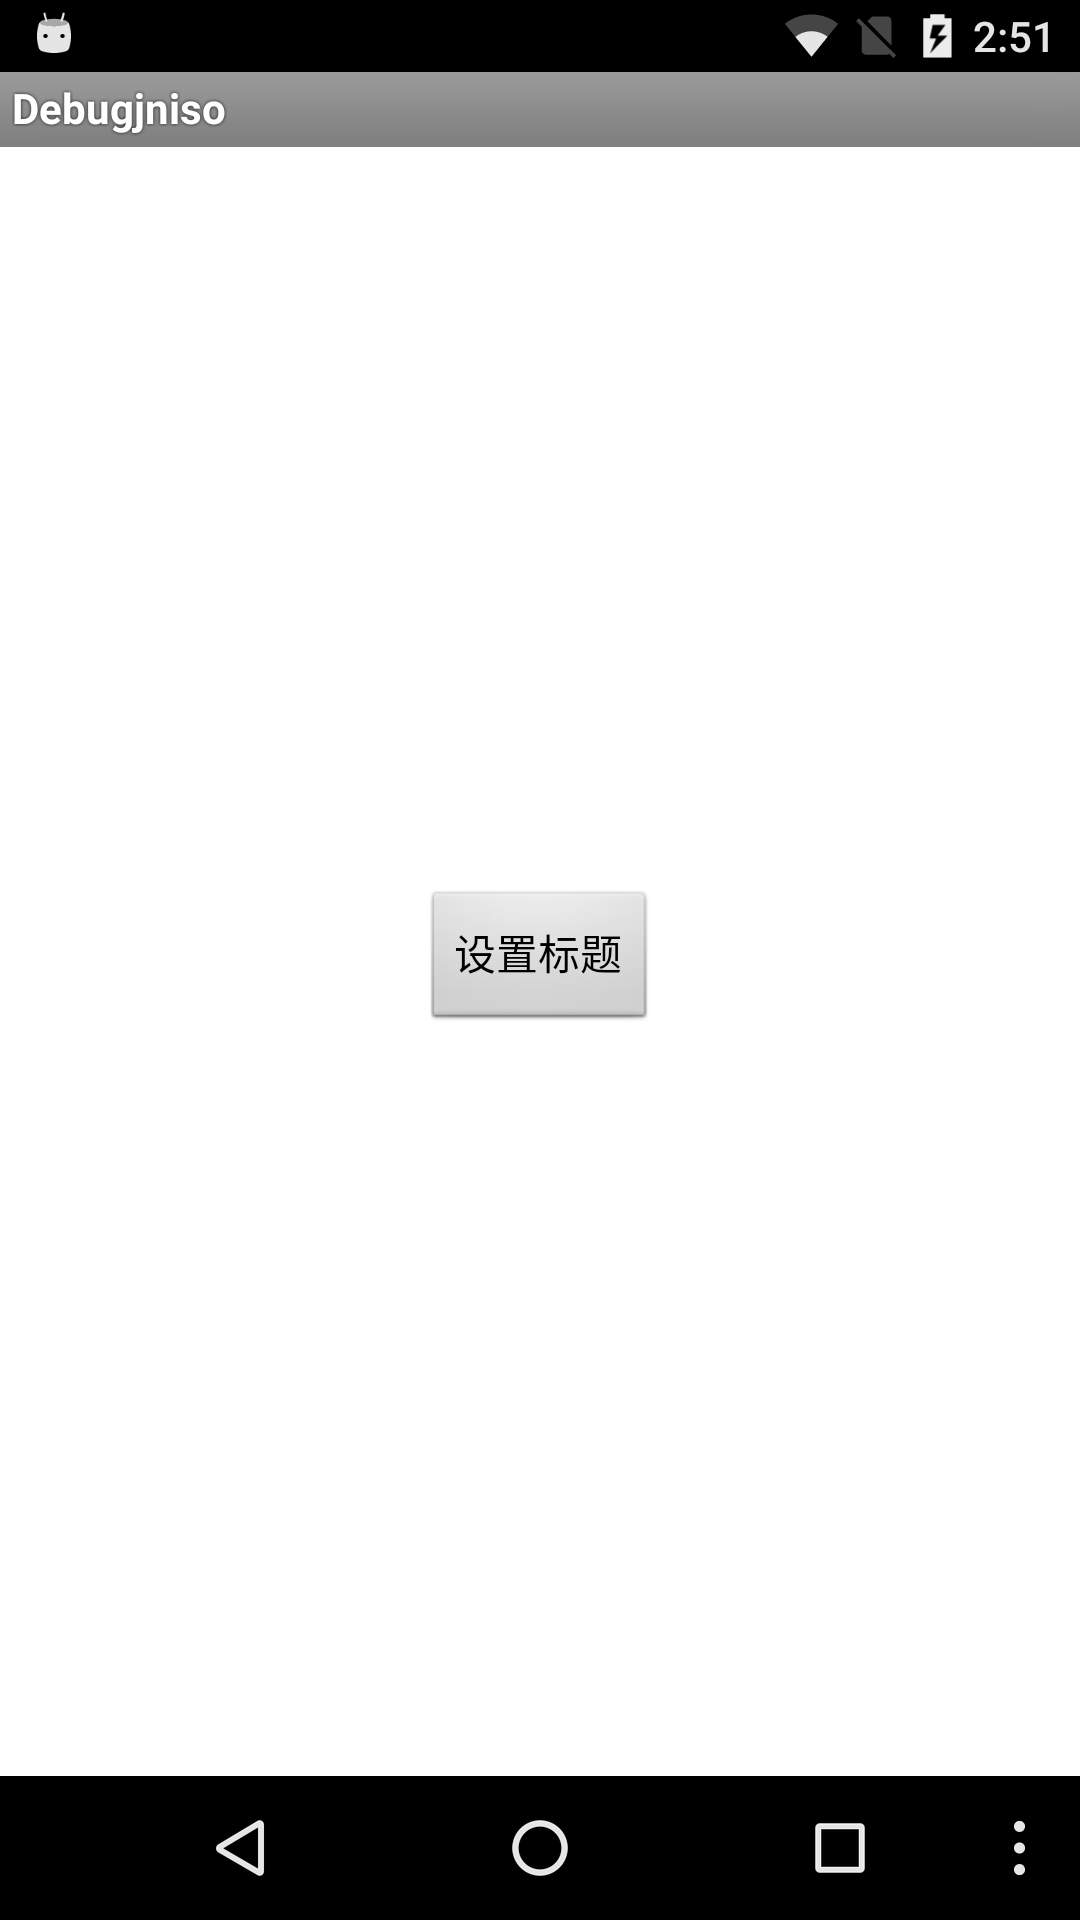
At this point, we click the "Set Title" button on the app interface (the reason for pressing this is that the native API is called within this function). Looking at IDA again, we can see that the SO library has been loaded:
B3B05000: loaded /data/app/com.droider.debugjniso-1/oat/arm/base.odex
B39B9000: loaded /system/lib/hw/gralloc.msm8974.so
B39B2000: loaded /system/lib/libmemalloc.so
B39AA000: loaded /system/lib/libqdutils.so
B3B00000: loaded /data/app/com.droider.debugjniso-1/lib/arm/libdebugjniso.so
At this point, we use ctrl+s to locate the library's base address at 0xB3B00000. Then based on:
Absolute Address = Base Address + Relative Offset
We can calculate the address of jnistring.
Observing the Results
Press g, then enter +0xC38, and click ok to jump to the function:
libdebugjniso.so:B3B00C38 Java_com_droider_debugjniso_TestJniMethods_jniString
libdebugjniso.so:B3B00C38 LDR             R1, =(unk_B3B02148 - 0xB3B00C4C)
libdebugjniso.so:B3B00C3C STMFD           SP!, {R4,LR}
libdebugjniso.so:B3B00C40 LDR             R3, [R0]
libdebugjniso.so:B3B00C44 ADD             R1, PC, R1 ; unk_B3B02148
libdebugjniso.so:B3B00C48 MOV             LR, PC
We set a breakpoint with F2 at the beginning of this function, then press F9 to continue execution. At the same time, looking at the phone, you can see that the app's title has changed to Hello! Nativemethod.
At this point, the basic debugging steps for SO native programs are complete.
Notes:
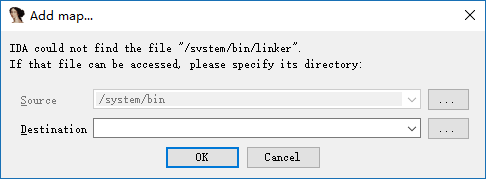
If an "add map" dialog box appears in the middle, just click Cancel and then apply.
Considerations
- When debugging an APK using an emulator and encountering exceptions, it is likely that the application detects whether it is running in an emulator environment. Consider using a real phone instead.
- When debugging an APK using a real device, you may also encounter exceptions where execution gets stuck on a particular instruction. In this case, you can manually execute that instruction and then set the PC to the address of the next instruction.
Basic Native Program Debugging - Method 2
To be added.