Wireshark
Introduction to Common Wireshark Features
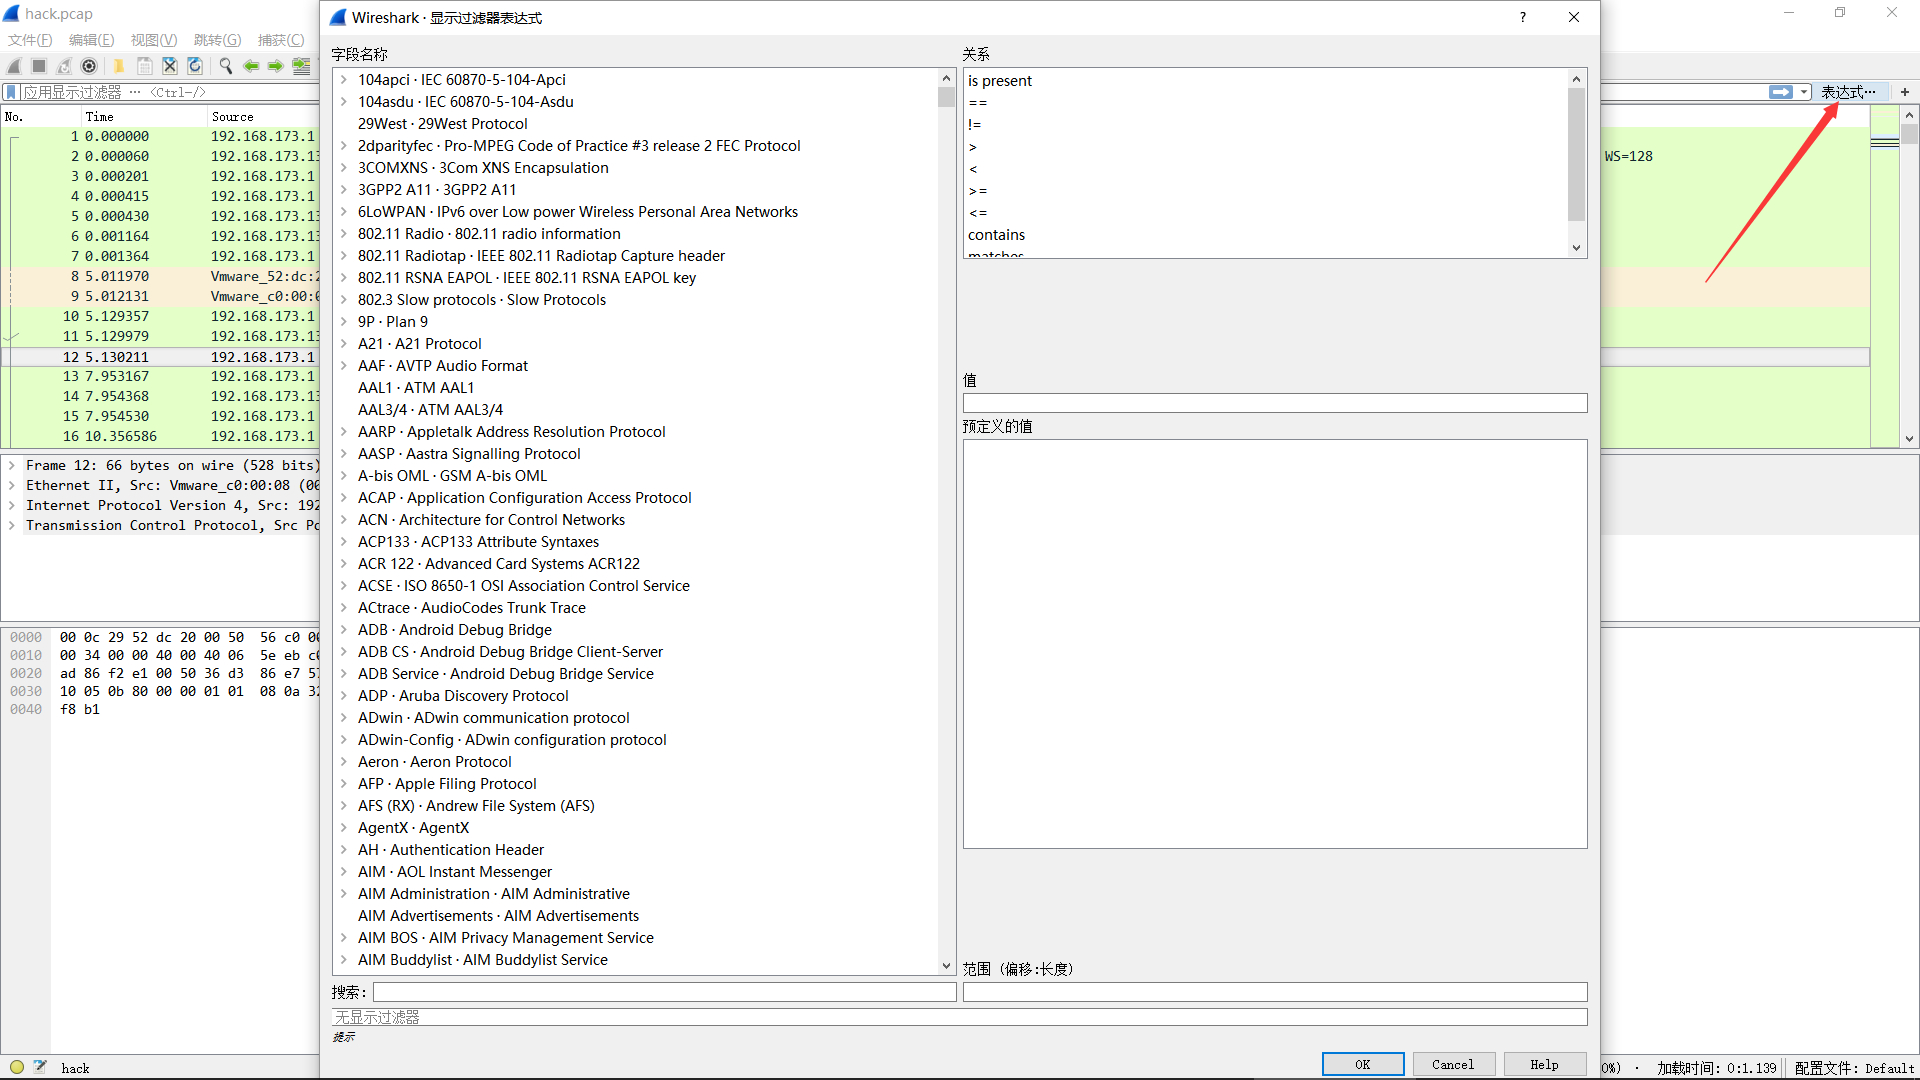
Display Filters
Display filters can use many different parameters as matching criteria, such as IP addresses, protocols, port numbers, and certain protocol header parameters. Additionally, users can create more complex expressions using conditional tools and concatenation operators. Users can combine different expressions to make the displayed packet range more precise. All data packets displayed in the packet list panel can be filtered using the fields contained in the packets.
[not] Expression [and|or] [not] Expression
Various operators are frequently used:
| Operator | Description |
|---|---|
| == | Equal to |
| != | Not equal to |
| > | Greater than |
| < | Less than |
| >= | Greater than or equal to |
| <= | Less than or equal to |
| And | and , && |
| Or | or , || |
| Not | ! , not |
Configuration Methods
- Using the filter window
- Using the toolbar input field
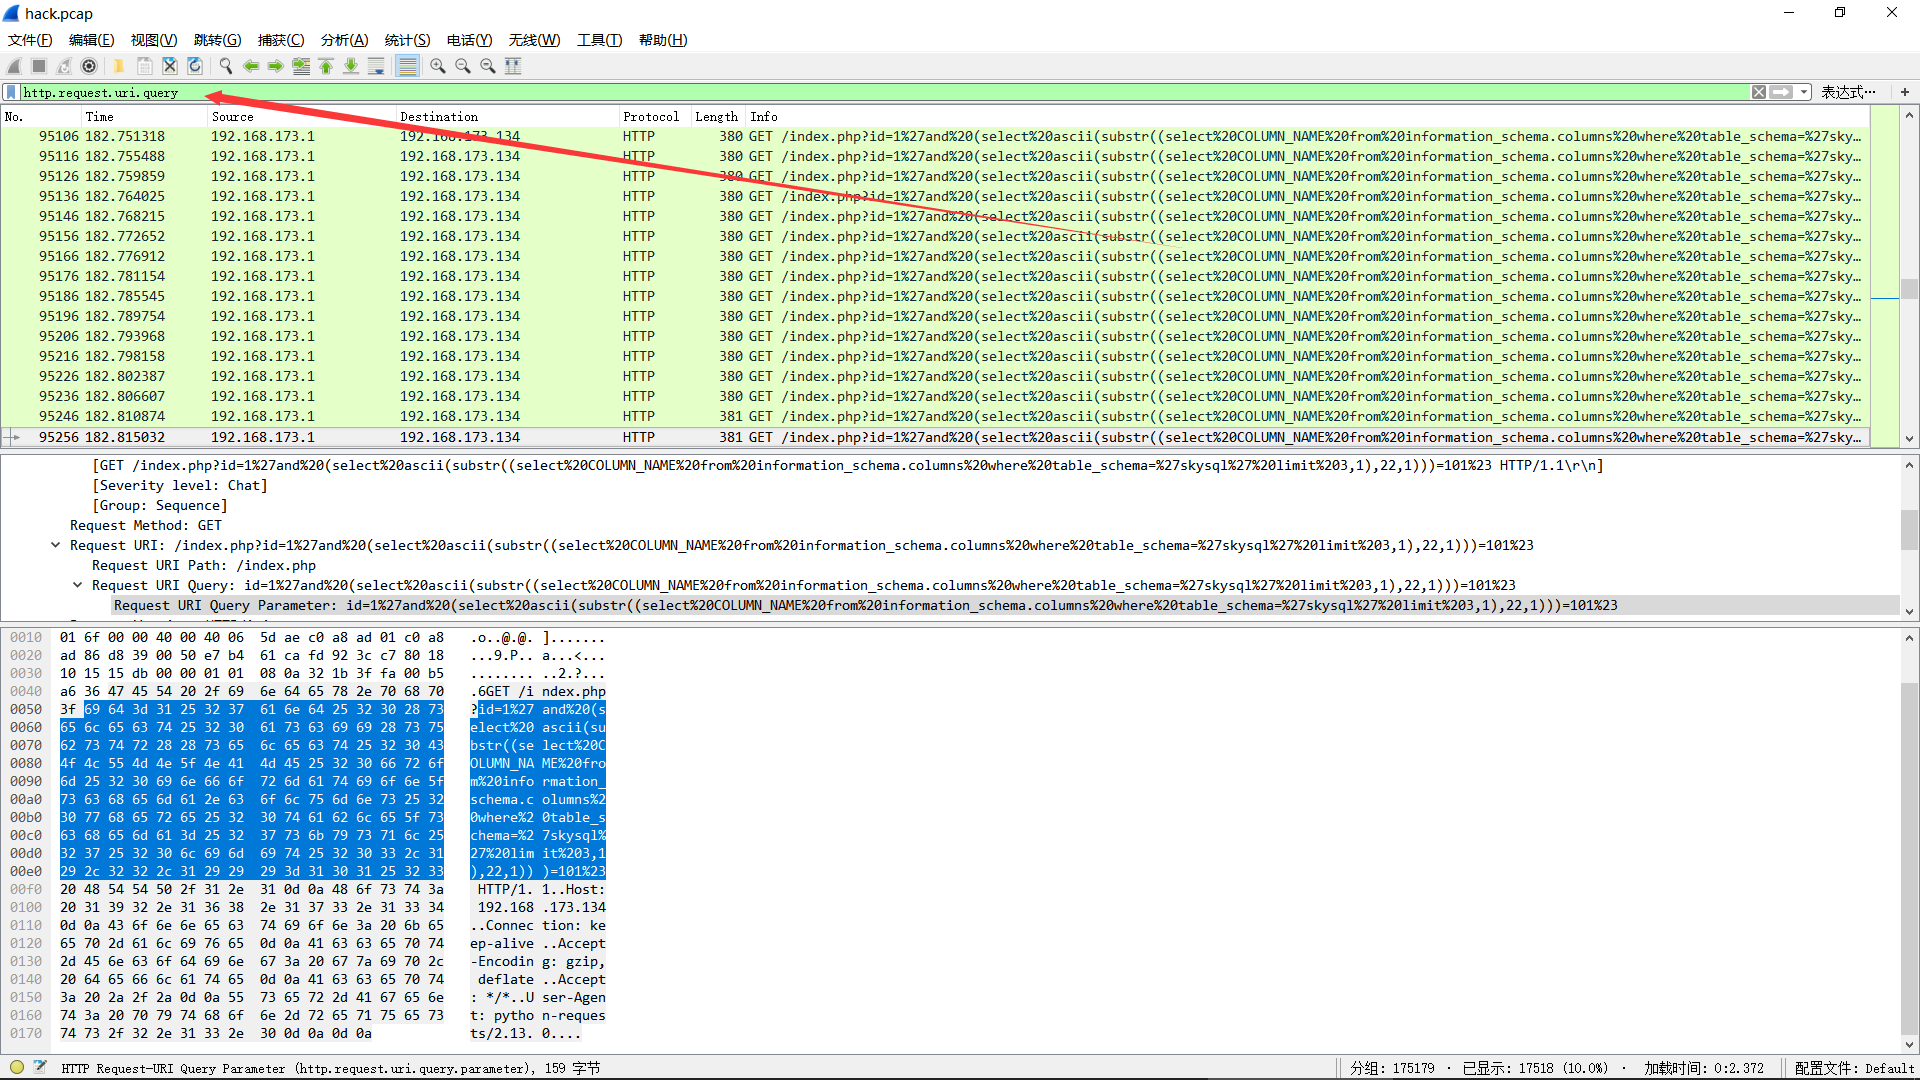
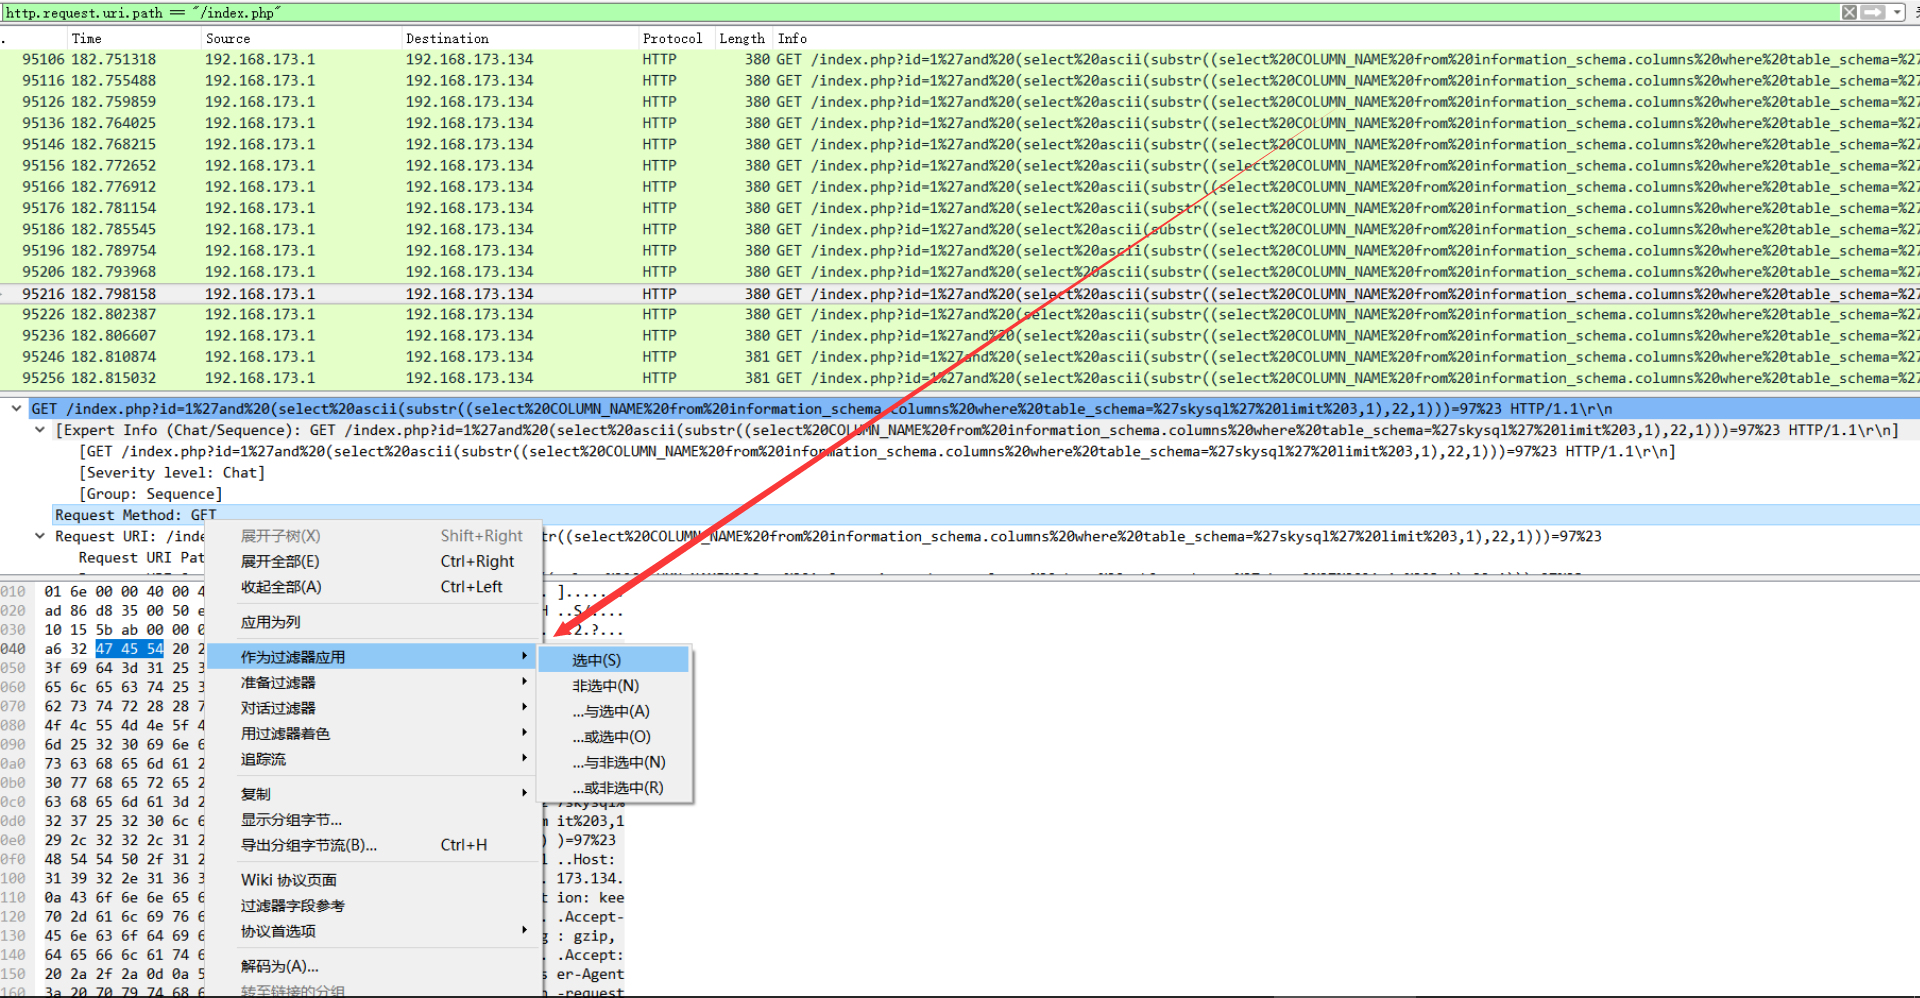
- Specifying a packet attribute value as a filter condition
Note
Complex filter commands can be directly obtained through the third method to get the filter syntax.
Statistics
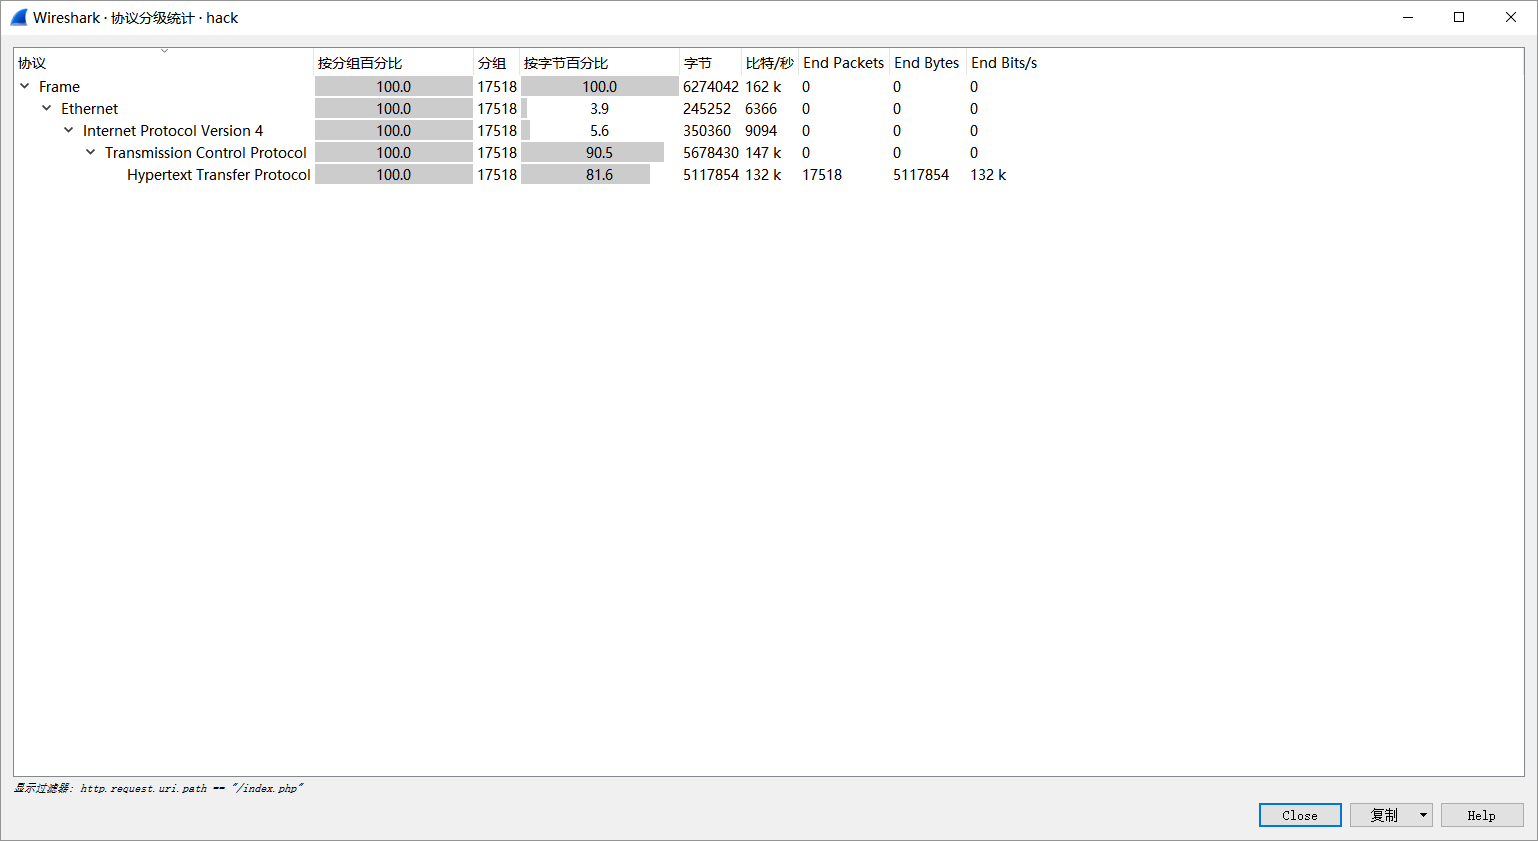
Protocol Hierarchy
This window displays a tree-structured breakdown of all protocols contained in the capture file.
Fields included:
| Name | Description |
|---|---|
| Protocol: | Protocol name |
| % Packets: | Percentage of packets containing this protocol out of all packets in the capture file |
| Packets: | Number of packets containing this protocol |
| Bytes: | Number of bytes containing this protocol |
| Mbit/s: | Protocol bandwidth during the capture period |
| End Packets: | Number of packets of this protocol (as the highest protocol layer in the file) |
| End Bytes: | Number of bytes of this protocol (as the highest protocol layer in the file) |
| End Mbit/s: | Protocol bandwidth during the capture period (as the highest protocol layer in the file) |
This feature can provide a basis for determining the main direction of packet analysis.
Conversation
All traffic occurring between specific endpoint IP pairs.
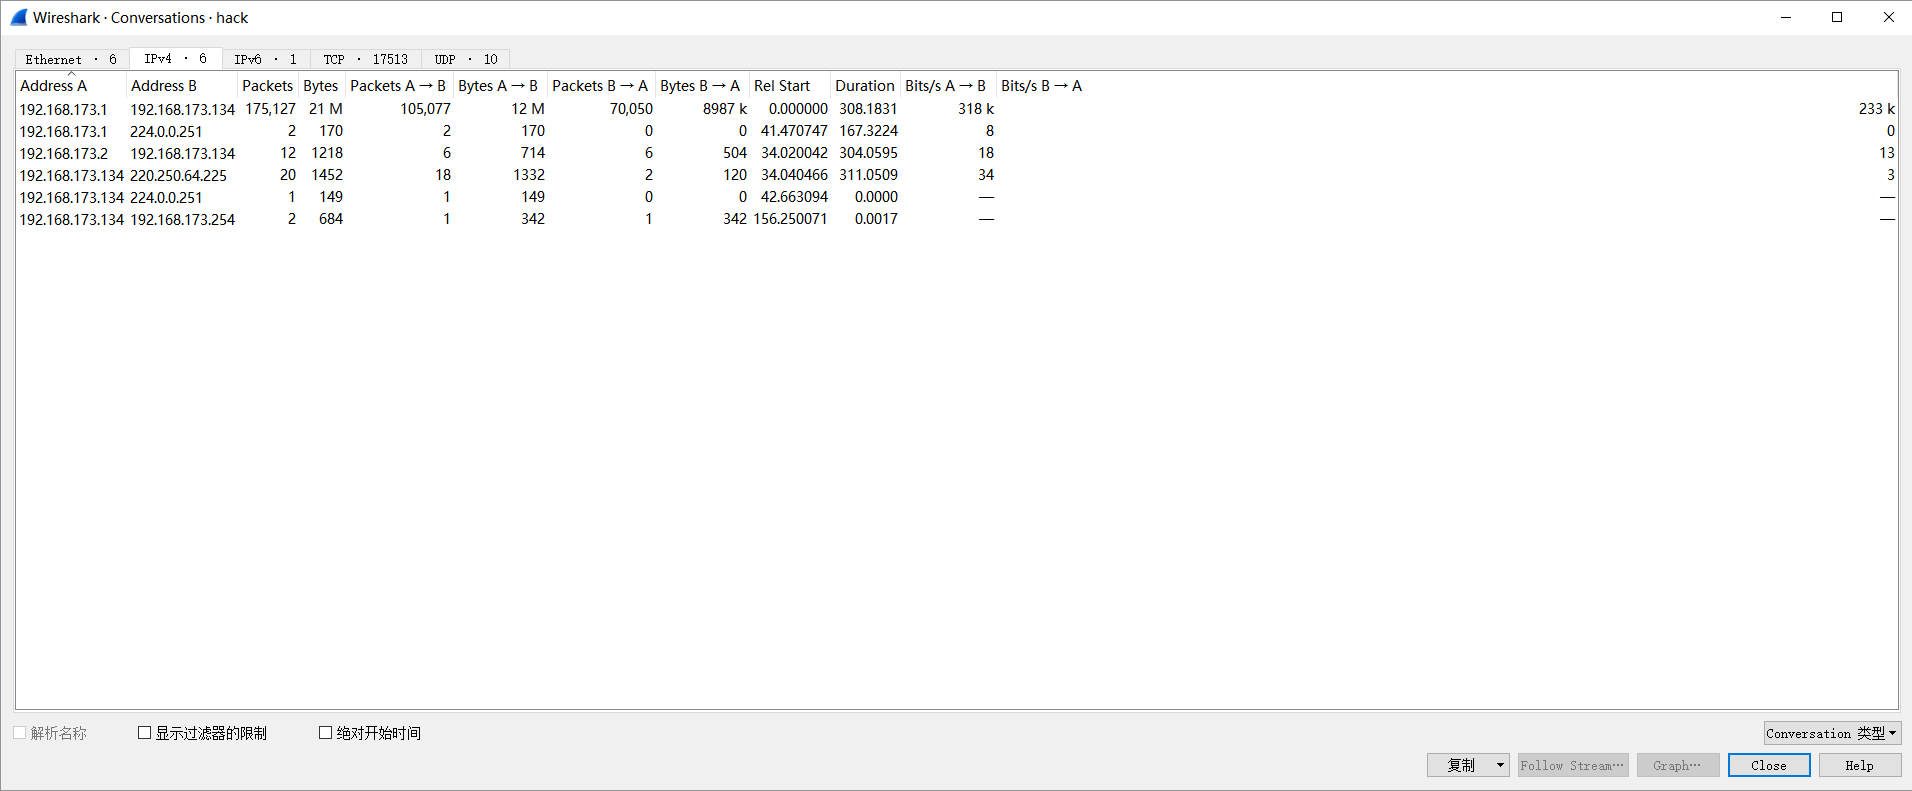
Note
- Look for IP addresses sending and receiving large amounts of data. If it's a known server (you remember the server's address or address range), then the issue is resolved; but it could also be a device scanning the network, or simply a PC generating too much data. - Look for scan patterns. This could be a normal scan, such as SNMP software sending ping messages to discover the network, but usually scans are not a good sign.
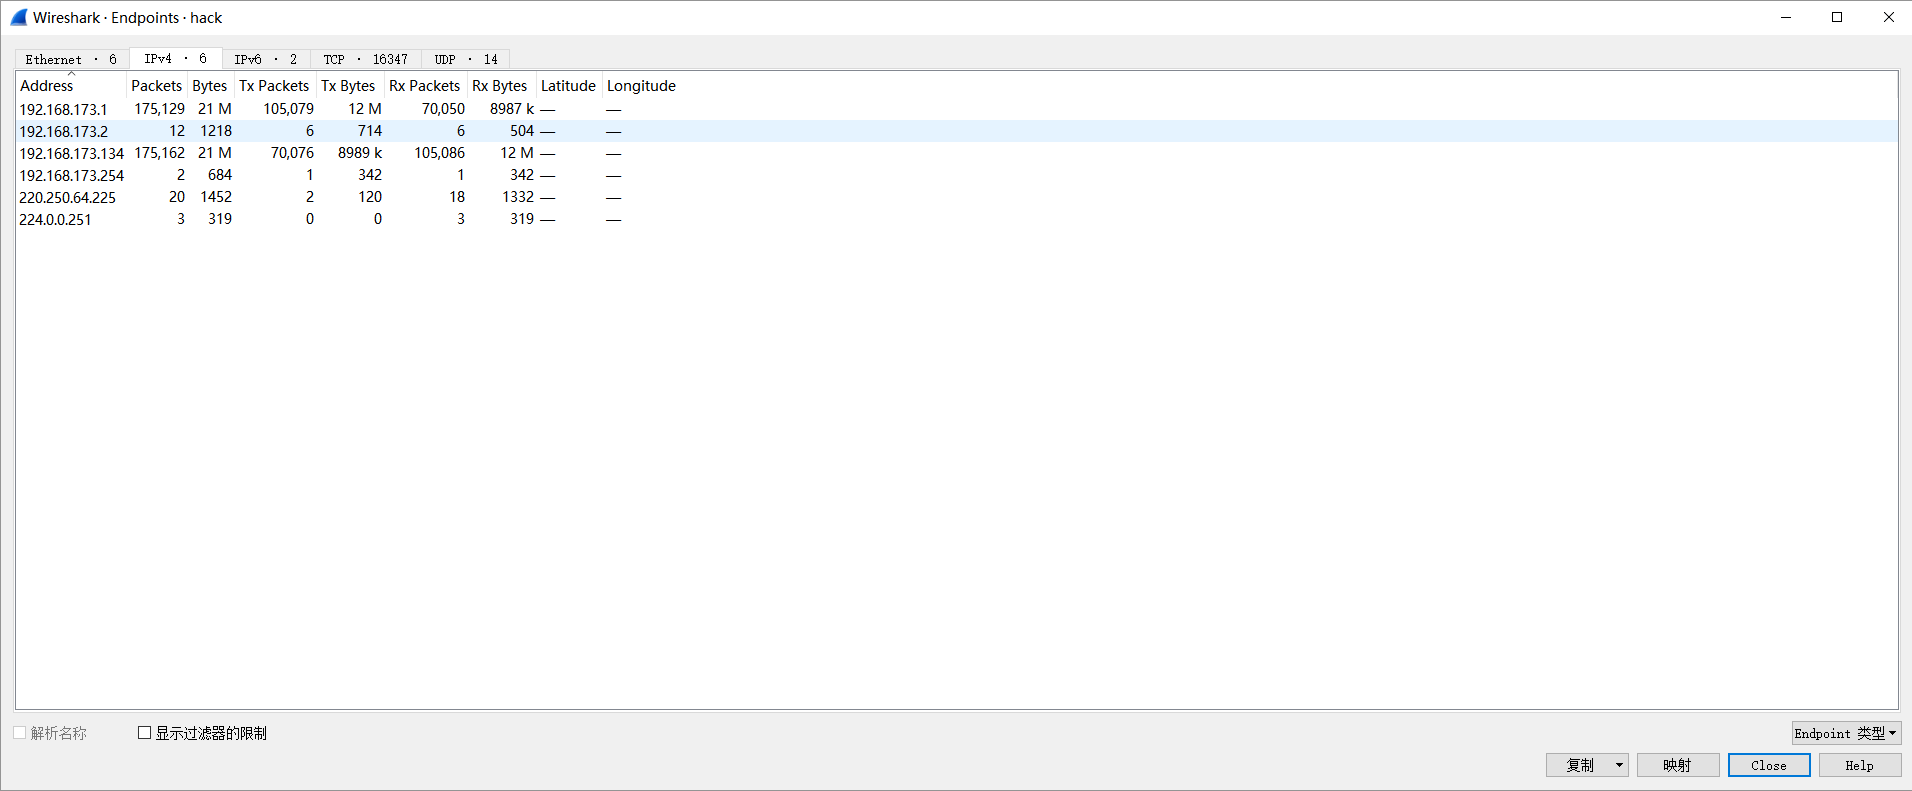
EndPoints
This tool lists statistics for all endpoints discovered by Wireshark.
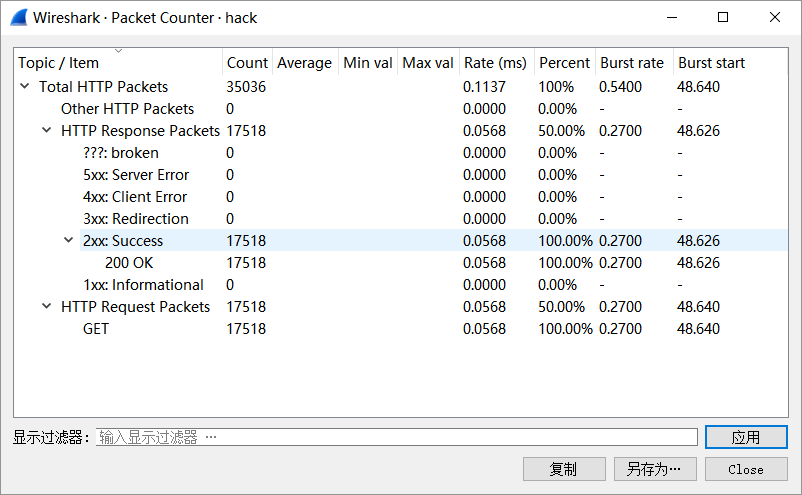
HTTP
- Packet Counter
References
Statistics - Advanced
Quickly grasp the overall characteristics of the traffic capture based on the summary information to understand what is happening?
TODO