Anti-Debugging Techniques Example
Let's now analyze an anti-debugging challenge from 2016 SecCon. Download link: bin.exe
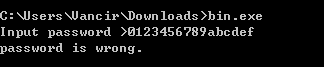
This is a 32-bit PE file, a console application. When we run it directly, it asks for a password input. If you enter an incorrect password, it will display password is wrong.
Let's open it in IDA. The quickest approach is to look at the strings and locate the key code by searching for password is wrong. The IDA results are shown below:
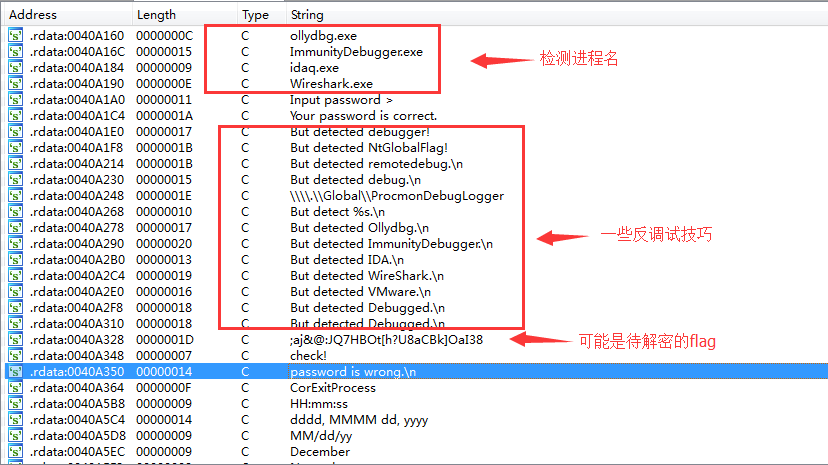
Clearly, the strings indicate the program likely has various checks, such as detecting process names like ollydbg.exe, ImmunityDebugger.exe, idaq.exe, and Wireshark.exe. There are also other detection mechanisms. We can also see the strings password is wrong and You password is correct. Additionally, we notice a string that is very likely an encrypted flag waiting to be decrypted. Let's follow the cross-reference from password is wrong to locate the key function.
As shown below: the program indeed uses a large number of anti-debugging techniques.
int __cdecl main(int argc, const char **argv, const char **envp)
{
  v23 = 0;
  memset(&v24, 0, 0x3Fu);
  v22 = 1;
  printf("Input password >");
  v3 = (FILE *)sub_40223D();
  fgets(&v23, 64, v3);
  strcpy(v21, "I have a pen.");
  v22 = strncmp(&v23, v21, 0xDu); // 1. Direct plaintext string comparison with user input
  if ( !v22 )
  {
    puts("Your password is correct.");
    if ( IsDebuggerPresent() == 1 )     // 2. API: IsDebuggerPresent()
    {
      puts("But detected debugger!");
      exit(1);
    }
    if ( sub_401120() == 0x70 )         // 3. Check if PEB offset 0x68 equals 0x70. Detecting NtGlobalFlag()
    {
      puts("But detected NtGlobalFlag!");
      exit(1);
    }

    /*  BOOL WINAPI CheckRemoteDebuggerPresent(
     *    _In_    HANDLE hProcess,
     *    _Inout_ PBOOL  pbDebuggerPresent
     *  );
     */
    v4 = GetCurrentProcess();
    CheckRemoteDebuggerPresent(v4, &pbDebuggerPresent);
    if ( pbDebuggerPresent )            // 4. API: CheckRemoteDebuggerPresent()
    {
      printf("But detected remotedebug.\n");
      exit(1);
    }
    v13 = GetTickCount();
    for ( i = 0; i == 100; ++i )
      Sleep(1u);
    v16 = 1000;
    if ( GetTickCount() - v13 > 1000 )  // 5. Timing check
    {
      printf("But detected debug.\n");
      exit(1);
    }
    lpFileName = "\\\\.\\Global\\ProcmonDebugLogger";
    if ( CreateFileA("\\\\.\\Global\\ProcmonDebugLogger", 0x80000000, 7u, 0, 3u, 0x80u, 0) != (HANDLE)-1 )
    {
      printf("But detect %s.\n", &lpFileName);      // 6. Detecting ProcessMonitor
      exit(1);
    }
    v11 = sub_401130();     // 7. API: CreateToolhelp32Snapshot() to detect processes
    if ( v11 == 1 )
    {
      printf("But detected Ollydbg.\n");
      exit(1);
    }
    if ( v11 == 2 )
    {
      printf("But detected ImmunityDebugger.\n");
      exit(1);
    }
    if ( v11 == 3 )
    {
      printf("But detected IDA.\n");
      exit(1);
    }
    if ( v11 == 4 )
    {
      printf("But detected WireShark.\n");
      exit(1);
    }
    if ( sub_401240() == 1 )    // 8. Detection via VMware I/O port
    {
      printf("But detected VMware.\n");
      exit(1);
    }
    v17 = 1;
    v20 = 1;
    v12 = 0;
    v19 = 1 / 0;
    ms_exc.registration.TryLevel = -2;  // 9. SEH
    printf("But detected Debugged.\n");
    exit(1);
  }
  printf("password is wrong.\n");
  return 0;
}
I've added comments in the code listing the 9 protection techniques used. Let's analyze them one by one.
Plaintext String Comparison
printf("Input password >");
v3 = (FILE *)sub_40223D();
fgets(&v23, 64, v3);
strcpy(v21, "I have a pen.");
v22 = strncmp(&v23, v21, 0xDu); // 1. Direct plaintext string comparison with user input
if ( !v22 )  {
    ......
}
This outputs Input password >, then uses fgets() to get the user's input string, copies I have a pen. into the v21 buffer, and then uses strncmp to compare the user input with I have a pen., storing the comparison result in v22. The subsequent code will branch based on v22, i.e., whether the entered password is correct.
IsDebuggerPresent()
puts("Your password is correct.");
if ( IsDebuggerPresent() == 1 )     // 2. API: IsDebuggerPresent()
{
    puts("But detected debugger!");
    exit(1);
}
Obviously, if the entered password is correct, it outputs the message Your password is correct.. ??? Doesn't that seem strange? Does that mean I have a pen. is our flag? No, of course not. This is actually a trap — since you now know I have a pen., you must have used some form of reverse engineering to analyze the program. So the following sections begin performing various anti-debugging and other detection techniques (such traps can also appear in real-world scenarios).
The first check is IsDebuggerPresent(), which determines the presence of a debugger based on its return value. If you're not familiar with it, you can refer back to the IsDebuggerPresent() section.
NtGlobalFlag
Next is checking the NtGlobalFlag field flags. It detects a debugger by checking whether the PEB field value equals 0x70. If you're not familiar with it, you can refer back to the NtGlobalFlag section.
if ( sub_401120() == 0x70 )         // 3. Check if PEB offset 0x68 equals 0x70. Detecting NtGlobalFlag()
{
    puts("But detected NtGlobalFlag!");
    exit(1);
}
Let's take a quick look at sub_401120():
int sub_401120()
{
  return *(_DWORD *)(__readfsdword(48) + 0x68) & 0x70;
}
0x68 is the offset corresponding to the NtGlobalFlag field in the PEB. 0x70 represents the combination of three flags: FLG_HEAP_ENABLE_TAIL_CHECK (0x10), FLG_HEAP_ENABLE_FREE_CHECK (0x20), and FLG_HEAP_VALIDATE_PARAMETERS (0x40).
CheckRemoteDebuggerPresent
/*  BOOL WINAPI CheckRemoteDebuggerPresent(
 *    _In_    HANDLE hProcess,
 *    _Inout_ PBOOL  pbDebuggerPresent
 *  );
 */
v4 = GetCurrentProcess();
CheckRemoteDebuggerPresent(v4, &pbDebuggerPresent);
if ( pbDebuggerPresent )            // 4. API: CheckRemoteDebuggerPresent()
{
    printf("But detected remotedebug.\n");
    exit(1);
}
CheckRemoteDebuggerPresent() in the comments. If a debugger is detected, pbDebuggerPresent is set to a non-zero value. The debugger is detected based on this value (see the CheckRemoteDebuggerPresent() section). Timing Check
v13 = GetTickCount();
for ( i = 0; i == 100; ++i )    // Sleep
    Sleep(1u);
v16 = 1000;
if ( GetTickCount() - v13 > 1000 )  // 5. Timing check
{
    printf("But detected debug.\n");
    exit(1);
}
GetTickCount returns the number of milliseconds since system startup. The loop alone executes sleep(1) 100 times, which amounts to 100 milliseconds. If the difference between the two time measurements exceeds 1000 milliseconds, the time difference is clearly much larger than the expected execution time, which indirectly indicates the presence of a debugger.
ProcessMonitor
lpFileName = "\\\\.\\Global\\ProcmonDebugLogger";
if ( CreateFileA("\\\\.\\Global\\ProcmonDebugLogger", 0x80000000, 7u, 0, 3u, 0x80u, 0) != (HANDLE)-1 )
{
    printf("But detect %s.\n", &lpFileName);      // 6. Detecting ProcessMonitor
    exit(1);
}
This detects ProcessMonitor by checking for the device file \\\\.\\Global\\ProcmonDebugLogger.
Process Name Detection
Here the sub_401130() function is called to detect processes and returns different values based on which process is detected.
v11 = sub_401130();     // 7. API: CreateToolhelp32Snapshot() to detect processes
if ( v11 == 1 )
{
    printf("But detected Ollydbg.\n");
    exit(1);
}
if ( v11 == 2 )
{
    printf("But detected ImmunityDebugger.\n");
    exit(1);
}
if ( v11 == 3 )
{
    printf("But detected IDA.\n");
    exit(1);
}
if ( v11 == 4 )
{
    printf("But detected WireShark.\n");
    exit(1);
}
Let's look at the sub_401130() function:
signed int sub_401130()
{
  PROCESSENTRY32 pe; // [sp+0h] [bp-138h]@1
  HANDLE hSnapshot; // [sp+130h] [bp-8h]@1
  int i; // [sp+134h] [bp-4h]@1

  pe.dwSize = 296;
  memset(&pe.cntUsage, 0, 0x124u);
  hSnapshot = CreateToolhelp32Snapshot(2u, 0);
  for ( i = Process32First(hSnapshot, &pe); i == 1; i = Process32Next(hSnapshot, &pe) )
  {
    if ( !_stricmp(pe.szExeFile, "ollydbg.exe") )
      return 1;
    if ( !_stricmp(pe.szExeFile, "ImmunityDebugger.exe") )
      return 2;
    if ( !_stricmp(pe.szExeFile, "idaq.exe") )
      return 3;
    if ( !_stricmp(pe.szExeFile, "Wireshark.exe") )
      return 4;
  }
  return 0;
}
Here the API CreateToolhelp32Snapshot is used to obtain information about currently running processes. It then iterates through the process list in the for loop. If a specified process name is found, it immediately returns the corresponding value. The return value is then used to branch into different code paths.
VMware Detection
VMware detection also involves checking for certain characteristics. The result of the check determines the outcome.
if ( sub_401240() == 1 )    // 8. Detection via VMware I/O port
{
    printf("But detected VMware.\n");
    exit(1);
}
Let's look at the sub_401240() function:
signed int sub_401240()
{
  unsigned __int32 v0; // eax@1

  v0 = __indword(0x5658u);
  return 1;
}
This is a VMware "backdoor" I/O port, where 0x5658 = "VX". If the program is running inside VMware, when the program uses the In instruction to read data through port 0x5658, the EBX register value will become 0x564D5868 (0x564D5868 == "VMXh").
The IDA decompiled pseudo-C code doesn't show this very intuitively. Let's look at the assembly code for a clearer picture:
.text:0040127A                 push    edx
.text:0040127B                 push    ecx
.text:0040127C                 push    ebx
.text:0040127D                 mov     eax, 564D5868h   //  <------
.text:00401282                 mov     ebx, 0
.text:00401287                 mov     ecx, 0Ah
.text:0040128C                 mov     edx, 5658h   //  <------
.text:00401291                 in      eax, dx
.text:00401292                 pop     ebx
.text:00401293                 pop     ecx
.text:00401294                 pop     edx
Further reading: E-cards don?t like virtual environments
SEH
v17 = 1;
v20 = 1;
v12 = 0;
v19 = 1 / 0;    // 9. SEH
ms_exc.registration.TryLevel = -2;
printf("But detected Debugged.\n");
exit(1);
This next section looks quite strange, doesn't it? Here, v19 = 1 / 0; is obviously invalid and will trigger a divide-by-zero exception. The following ms_exc.registration.TryLevel = -2; unregisters the exception handler, where TryLevel=TRYLEVEL_NONE (-2). Let's look at the assembly code:
.text:004015B8                 mov     [ebp+var_88], 1
.text:004015C2                 mov     [ebp+var_7C], 1
.text:004015C9                 mov     [ebp+var_9C], 0
.text:004015D3                 mov     [ebp+ms_exc.registration.TryLevel], 0
.text:004015DA                 mov     eax, [ebp+var_7C]
.text:004015DD                 cdq
.text:004015DE                 idiv    [ebp+var_9C]
.text:004015E4                 mov     [ebp+var_80], eax
.text:004015E7                 mov     [ebp+ms_exc.registration.TryLevel], 0FFFFFFFEh
.text:004015EE                 jmp     short loc_40160A
After the idiv [ebp+var_9C] triggers the exception, the program's registered exception handler takes over. If a breakpoint is not set at the exception handler entry point, the program can easily run away from the debugger.
Obtaining the Flag
But after looking through the entire program, it seems like nothing is related to the flag. Do you remember the string we saw in the strings window that looked like an encrypted flag waiting to be decrypted? In fact, due to IDA's decompilation limitations, the decompiled pseudo-C code is not entirely accurate. For example, at the printf("But detected Debugged.\n"); in the last section, let's look at the actual assembly code:
.text:00401627                 call    sub_4012E0
.text:0040162C                 movzx   eax, ax
.text:0040162F                 mov     [ebp+var_A8], eax
.text:00401635                 cmp     [ebp+var_A8], 0      // <------
.text:0040163C                 jz      short loc_401652     // <------
.text:0040163E                 push    offset aButDetectedD_2 ; "But detected Debugged.\n"
.text:00401643                 call    _printf
.text:00401648                 add     esp, 4
.text:0040164B                 push    1               ; int
.text:0040164D                 call    _exit
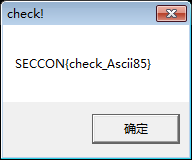
In fact, this section of code was not decompiled by IDA. The loc_401652 location contains a sequence of code, with the highlight being the use of a MessageBoxA function. And one of the function arguments is our encrypted flag waiting to be decrypted. So after entering I have a pen., we can manually modify the jump at the if ( !v22 ) assembly code to redirect execution to the flag decryption and messagebox display section, letting the program decrypt and output the flag for us.
The operation is shown in the following image:
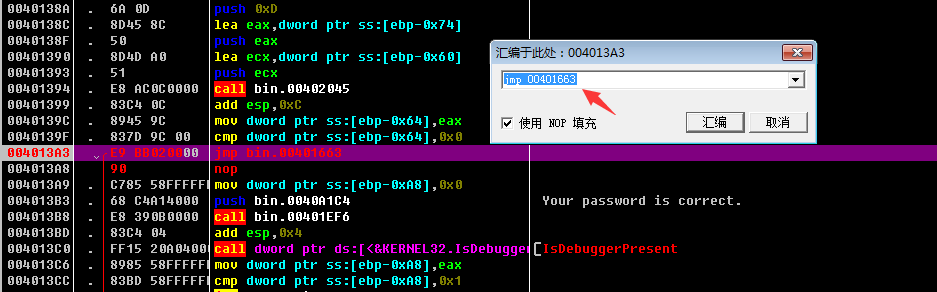
This is the jump section after entering I have a pen.. Since the normal jump destination is entirely filled with debugger detection code, we jump directly to the decryption section, which is at address 00401663.
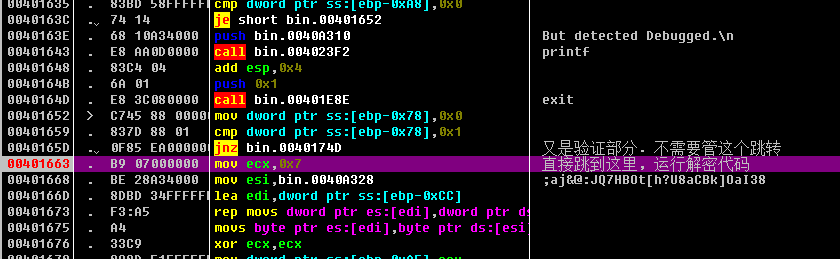
The mov-cmp-jnz sequence above 00401663 is also a verification section, so we can ignore it and jump directly to 00401663 where mov ecx, 7 begins the decryption code. The execution then continues to MessageBoxA(), which pops up a message box and reveals the flag.