Single-Step Tracing Method
The principle of the single-step tracing method is to use OllyDbg's step over (F8), step into (F7), and run to (F4) functions to completely walk through the program's self-unpacking process, skip over some loop code restoration segments, and use step into to ensure the program does not skip past the OEP. This way, after the software's automatic unpacking module finishes running, you can reach the OEP and dump the program.
Key Points
- Open the program and press F8 to single-step downward, trying to follow downward
jmpjumps - You will frequently encounter large loops — use F4 to skip over these loops
- If the function has a
call(near call) not far from where it loads, try not to step over it directly, but instead step into thecall - Generally,
jmpinstructions with large jump distances are very likely jumping to the Original Entry Point (OEP)
Example
The sample program can be downloaded here: 1_trace.zip
The single-step tracing method essentially means stepping through the program from the entry point as much as possible. During the single-step process, be careful that the EIP does not go off track. However, for some more complex packers, the single-step process can be extremely tedious and easy to get confused by. Therefore, single-step tracing is also commonly used to analyze specific key code sections (combined with static analysis), rather than analyzing everything completely from start to finish — doing so would go against the philosophy of reverse engineering.
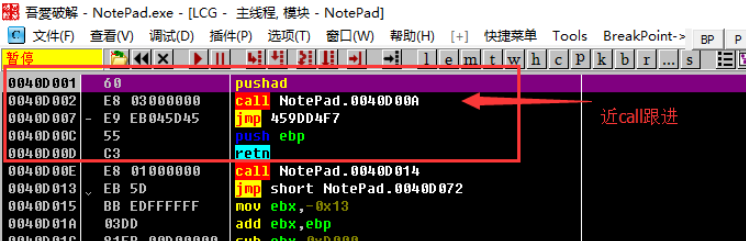
Open the Notepad.exe from the archive with OllyDbg, and it stops at the position shown below. The entry point is a pushad that saves all register states to the stack, followed by a call to the function at 0040D00A. After the call, there is an unconditional jump to 459DD4F7, and the subsequent push ebp and retn clearly have no practical meaning. When there is a call near the entry point like this, we call it a "near call". For near calls, we choose to step into by pressing F7 (in fact, you can only choose to step into — otherwise the EIP would go off track and the program would stop).
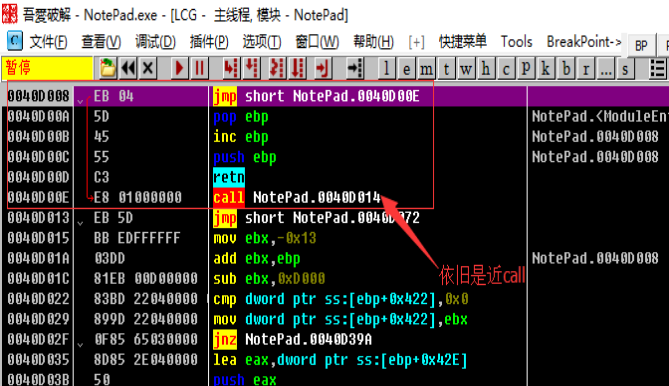
After stepping in, there is another call. We continue to step into by pressing F7. After following it, we find there are no more near calls. We can see the program is calling APIs like GetModuleHandleA and GetProcAddress. We continue analyzing downward.
After that, we encounter multiple jumps. We try to follow downward jumps and do not take upward jumps, using F4 to jump out of loops, until we reach 0040D3AF. Let's look at the following code:
0040D3AF    61                  popad
0040D3B0    75 08               jnz short NotePad.0040D3BA
0040D3B2    B8 01000000         mov eax,0x1
0040D3B7    C2 0C00             retn 0xC
0040D3BA    68 CC104000         push NotePad.004010CC
0040D3BF    C3                  retn
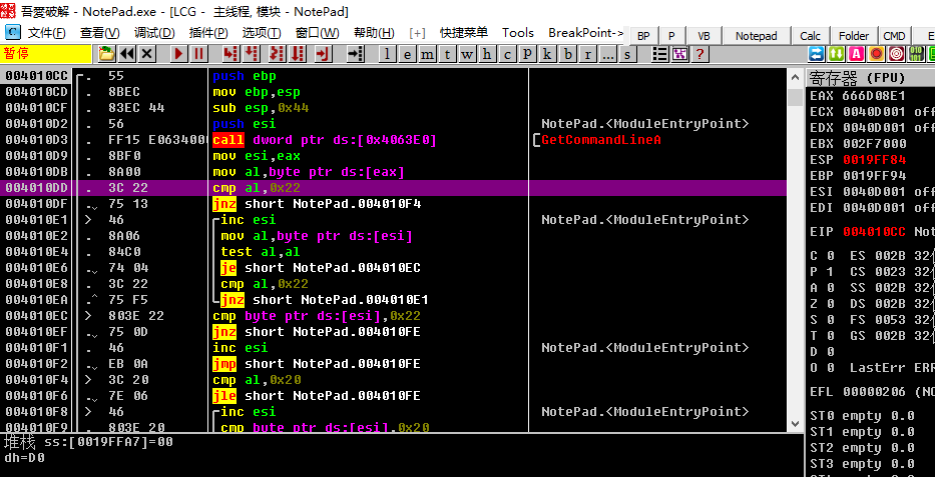
Here, popad restores the register states saved at the program entry point. Then jnz jumps to 0040D3BA, where push and retn are used to change EIP to 004010CC. This means that after the packer finishes decompressing code and other resources, it jumps via jnz to the push instruction, then uses push and ret to set EIP to the program's Original Entry Point (OEP) and returns to the OEP, where execution of the original program code continues. After executing to retn and returning, we can see the following:
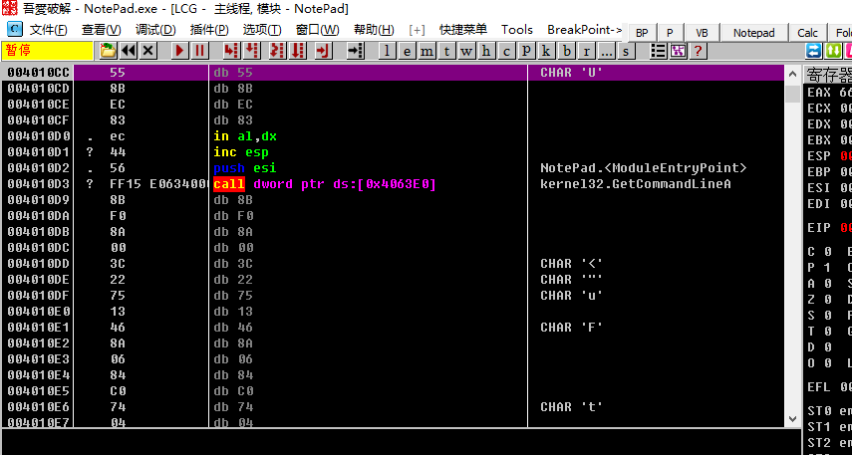
Clearly, we have arrived at a location that OllyDbg has mistakenly identified as data for continued execution. Obviously, OllyDbg's analysis was incorrect. We need to have OllyDbg re-analyze. We can right-click and select Analysis -> Remove Analysis from Module, or press Ctrl+A. This will correctly display the assembly instructions at the OEP.